Data Visualization in UiPath Data Service
Share at:

Visualizing data stored in UiPath Data Service
UiPath Data Service is a data storage mechanism that UiPath has incorporated into their product offering, which brings together the ability to perform powerful no-code data modeling and data storage capabilities in an automation environment. UiPath Data Services is integrated into UiPath Automation Cloud™. It can be implemented in UiPath Studio projects for version 2020.10 and higher.
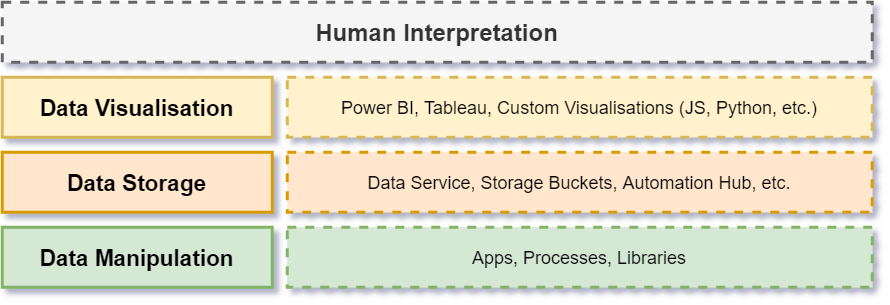
The very essence of being able to visualize data is to have the data accessible from some storage mechanism. Data visualization is the top-most level of data understanding from a technology perspective before human perspectives are used to analyze and interpret the visualizations. Data visualizations are empowered by the data storage and data manipulation mechanisms used to ensure the dataset is rich enough and realistic enough to gain an accurate understanding of the automation landscape.

Before being able to visualize data from the Data Service, entities need to be created and data needs to be inserted. This can be done from UiPath Studio, UiPath Apps, or even using the available API which can be used through Postman. The appropriate visualization tooling, in this case Power BI Desktop, should be installed.
Visualizing the data using Excel in SharePoint and Power BI
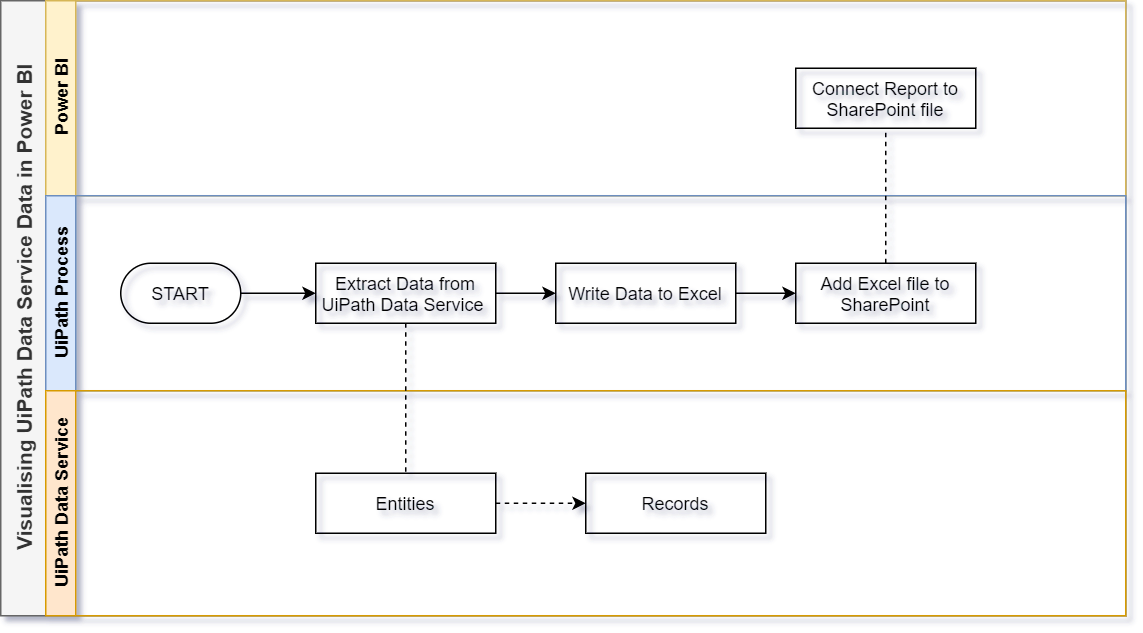
There are multiple options available to visualize data based on the amount of data, data service API limits, etc. The first option is to create an Excel spreadsheet in OneDrive or SharePoint and connect the Power BI report to the Excel spreadsheet. Use a process to update the spreadsheet with data from Data Service.

This approach will pose a work-around for any breaches of the API limit. This approach may be much slower as it would be dependent on the outcome of the syncing UiPath process that runs at a set frequency. The architecture could be enhanced by triggering the process every time a record has been created, edited, or removed from an entity. This would provide near real-time analytics, provided the syncing process doesn't run into any errors or exceptions.
Visualizing the data using Power BI and a custom connector
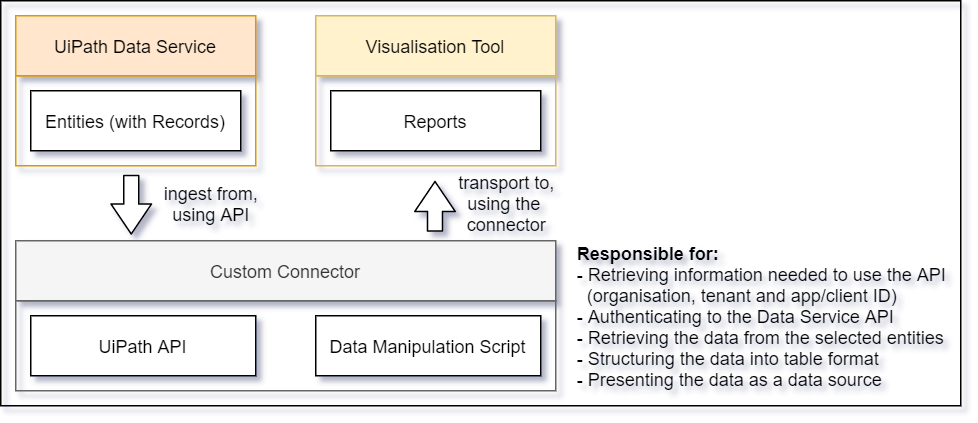
The second option would be to use a Power BI custom connector to work with the data stored in the UiPath Data Service, in Power BI, using the UiPath Data Service API. The custom connector will contain a Power Query script used to authenticate with and extract the data from the UiPath Data Service API.
To use this option, Visual Studio 2017 or 2019 would need to be installed. Version from 2022 doesn't play well with Power Query, which also needs to be downloaded and installed.
Since Power Query is vastly used across the Microsoft stack, the code used for the custom connector won't easily be translated into a script that'd work for other visualization tools. If other visualization tools are used, the same architecture and concept may be used.

This approach will enable fast and real-time insight into the data. The authentication method may pose a challenge with this approach as it may require manual authentication at times which may jeopardize the autonomy of the deployed solution. The approach to Multi-factor Authentication (MFA) used with UiPath may work as an appropriate work around, along with improved authentication types released by UiPath Data Service API. Another challenge may be the API limits imposed on the Data Service API.
Conclusion
Both options and approaches listed (as well as many others not mentioned) provide developers with the options to further use and enhance UiPath automations to enrich existing datasets currently stored in UiPath Data Services. If developers opted to rather use a different storage mechanism for data used and generated by automations (like Excel files, CSV files, or databases), the ability to visualize data from Data Service may provide good reason to make the switch. UiPath Data Service is designed taking into consideration best practices for cloud services.
Topics:
Data Service
Application Architect, Dimension Data
Get articles from automation experts in your inbox
SubscribeGet articles from automation experts in your inbox
Sign up today and we'll email you the newest articles every week.
Thank you for subscribing!
Thank you for subscribing! Each week, we'll send the best automation blog posts straight to your inbox.


